Modeling Heart Rate
I coded a program in MATLAB that creates a graphical model for my heart rate over time and my change in heart rate over time during a workout using data values from my Fitbit. This program also calculates my maximum heart rate and maximum change in heart rate over this interval. Furthermore, an additional program creates a graphical model of heart muscle contractions over time, and runs multiple times to compare the effects of varying blood pressure on heartbeat.
Main MATLAB Skills Used
-
Importing data and converting to matrixes/arrays
-
Polyval/polyfit to find polynomials of best fit
-
Creating functions to solve differential equations
-
Using for loops to run Euler's Method
-
Plotting arrays
Program 1 does the following:
-
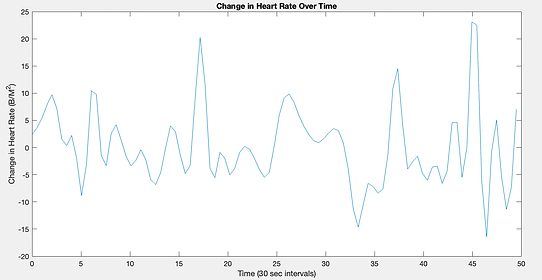
Fits a cubic spline with not-a-knot end conditions through my heart rate data points and calculates a differential equation to graph change in heart rate over time
-
A. Uses polynomial regression to create a polynomial to model a smaller interval around the highest peak of each graph
B. Uses the Golden Section search method to calculate my maximum heart rate and calculate my maximum change in heart rate
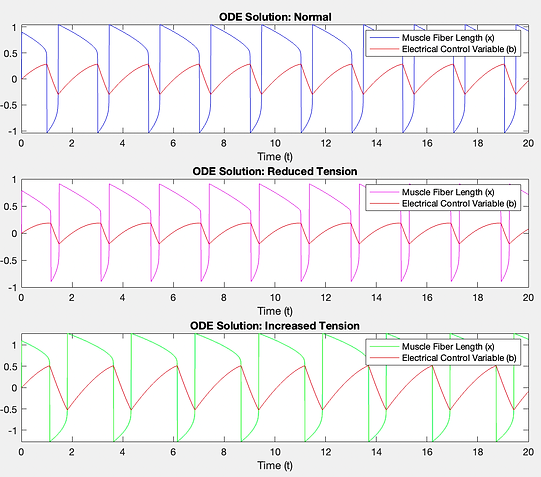
Program 2 does the following:
-
Graphs a set of differential equations using Euler’s method with a step size of 0.0001 to model the heart beat cycle with 3 different cardiac muscle tensions: low, normal, and high
Outputs + Conclusions
Program 1
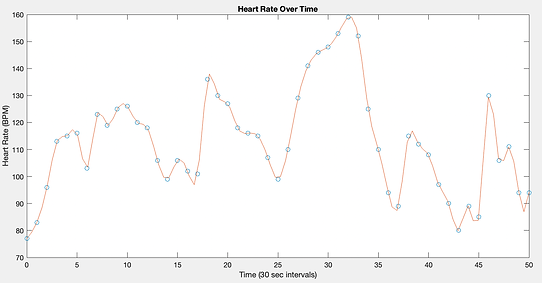
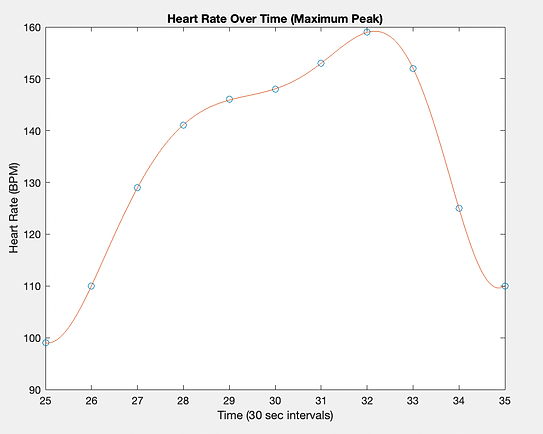
Maximum Heart Rate: ~159 BPM, t = 32.16 (30 sec intervals)
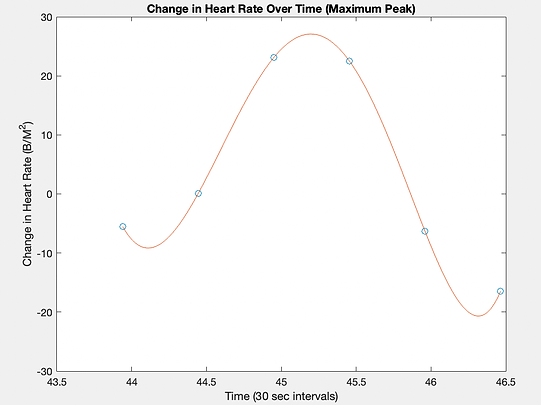
Maximum Change in Heart Rate: ~27 BPM2, t = 45.2 (30 sec intervals)
Program 2